


The US Financial Diaries were inspired by Portfolios of the Poor, financial diaries in Bangladesh, India, and South Africa. One of the key findings of that work was the highly variable incomes of people living under $2 a day.

When we began the US Financial Diaries we did not know how big of an issue income volatility would be for low- and moderate-income households in the United States.
It turns out it's a major issue.
Right at the beginning of the study we asked households whether they would prefer financial stability or moving up the income ladder. A majority chose the former. Chart 2.1 shows our results and compares them to the Pew Charitable Trust’s more nationally representative survey.
After we had gathered a year’s worth of data from our households, we looked at how much income volatility the households were actually experiencing. We measured this by calculating households’ income coefficient of variation, or CV. The formula looks like this:
Income CV = Standard deviation of monthly income
Average monthly income
For a frame of reference, a household whose only income source is a $50,000 a year salary with a one-time $500 holiday bonus has a CV of 18%. The CV of a household whose only income source is a full time $15 hourly wage job (with hours varying between 38 and 42 hours a week) with a one-time $300 bonus would be 16%. Both of these hypothetical households’ incomes look relatively flat, as we show in chart 2.5.
On the other hand, the USFD sample’s median CV is 33%. Chart 2.6 shows the month-to-month income of one of our households, the Garza’s, whose CV is 34%.


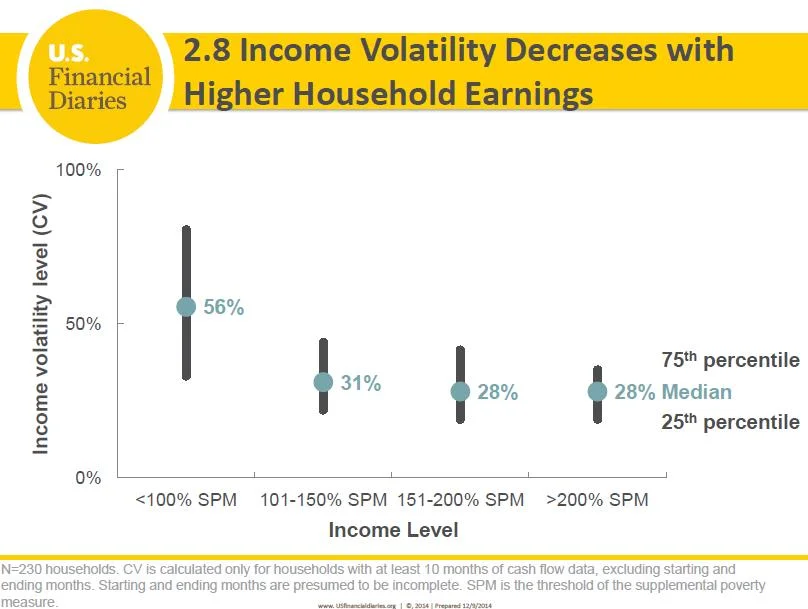
The lower a household’s income, the more likely they were to encounter higher income volatility. As chart 2.8 shows, the median CV for households in our lowest income bracket is 56% – twice as high as the highest income group’s median.
There are some good reasons a household might have high income volatility. Tax refunds and credits are a significant source of volatility. Those relatively big inflows can be very helpful, not harmful, to families. The CV numbers above exclude tax refunds or credits. Chart 2.7 shows that the median CV shoots up for households at every income level when we include tax income in the CV calculation.

Income volatility can be a big problem for households. For instance, it’s hard to make and stick to a budget when you don’t know what your income will be each month. It can also cause households to turn to costly solutions to short-term cash flow shortfalls.
In our continuing analysis, we’re looking in more detail at the sources of income volatility—irregular hours, benefits fluctuations, job turnover—and how predictable, or unpredictable, the volatility is. And of course we’ll be examining how households cope with spikes and dips in their incomes.
This is part of a series explaining initial findings from the US Financial Diaries. The project is lead by principal investigators Jonathan Morduch (NYU) and Rachel Schneider (CFSI). Julie Siwicki was a field researcher with the project and is now a research associate. The views expressed therein are those of the author, and not necessarily of the USFD project or its funders.